Proyecto 1 · Problem Framing
Project 1 · Problem Framing
Ranking de exoplanetas potencialmente habitables
Ranking of Potentially Habitable Exoplanets
Construcción de un índice interpretable para convertir la habitabilidad relativa de exoplanetas en un problema analizable con datos.
Building an interpretable index to turn relative exoplanet habitability into a data-analysable problem.
El problema
The Problem
La habitabilidad de un planeta no es una variable directamente observable ni existe una etiqueta que permita clasificar exoplanetas como habitables o no habitables. Se trata de un concepto físico complejo que depende de múltiples factores orbitales, planetarios y estelares que interactúan entre sí.
Desde el punto de vista de la ciencia de datos, esto convierte el problema en un problema mal definido: no existe variable objetivo, no hay un modelo que optimizar y no hay una métrica directa que permita ordenar los planetas según su habitabilidad.
Planet habitability is not a directly observable variable and there is no label that allows exoplanets to be classified as habitable or non-habitable. It is a complex physical concept that depends on multiple orbital, planetary and stellar factors that interact with each other.
From a data science perspective, this turns the problem into an ill-defined problem: there is no target variable, no model to optimise, and no direct metric that allows planets to be ranked according to their habitability.
Idea clave: el objetivo del proyecto fue transformar este problema difuso en un problema medible, construyendo una métrica interpretable que permitiera comparar exoplanetas en función de su similitud con la Tierra utilizando variables físicas y astronómicas.
Key idea: the goal of the project was to transform this vague problem into a measurable one by developing an interpretable metric that would allow for the comparison of exoplanets based on their similarity to Earth using physical and astronomical variables.
La solución
The Solution
Ante la ausencia de una variable objetivo observable, el proyecto no se orienta a predecir habitabilidad, sino a construir una forma de medirla de manera indirecta y operativa. La solución propuesta consiste en construir un índice de habitabilidad basado en similitud física con la Tierra.
En lugar de intentar clasificar planetas como habitables o no habitables, el modelo mide hasta qué punto cada exoplaneta se parece a la Tierra en un conjunto de variables orbitales, planetarias y estelares seleccionadas por su significado físico. Este enfoque transforma el problema original —difuso y no medible— en una magnitud cuantitativa continua que permite comparar todos los planetas bajo un mismo criterio.
El índice no pretende afirmar la existencia de vida ni certificar habitabilidad real, sino construir un criterio cuantitativo, reproducible e interpretable para priorizar exoplanetas potencialmente compatibles con condiciones terrestres. El resultado es una variable construida que actúa como eje del análisis: permite ordenar el catálogo completo, analizar la distribución de similitud con la Tierra y estudiar qué características físicas están asociadas a los planetas mejor posicionados en el ranking.
In the absence of an observable objective variable, the project does not aim to predict habitability, but rather to develop a way to measure it indirectly and practically. The proposed solution consists of developing a habitability index based on physical similarity to Earth.
Instead of attempting to classify planets as habitable or uninhabitable, the model measures the extent to which each exoplanet resembles Earth across a set of orbital, planetary, and stellar variables selected for their physical significance. This approach transforms the original problem—which is vague and unmeasurable—into a continuous quantitative scale that allows all planets to be compared using the same criteria.
The index does not aim to confirm the existence of life or certify actual habitability, but rather to establish a quantitative, reproducible, and interpretable criterion for prioritizing exoplanets that are potentially compatible with Earth-like conditions. The result is a constructed variable that serves as the core of the analysis: it allows us to sort the entire catalog, analyze the distribution of Earth-like characteristics, and study which physical features are associated with the highest-ranking planets.
Idea clave: este proyecto no intenta predecir habitabilidad a partir de etiquetas inexistentes. Lo que hace es construir una variable nueva y medible que convierte un problema difuso en un criterio cuantitativo, interpretable y operativo.
Key idea: this project does not attempt to predict habitability from non-existent labels. Instead, it builds a new measurable variable that turns a diffuse problem into a quantitative, interpretable and operational criterion.
Metodología
Methodology
Preparación del dataset
Reducción del catálogo NASA a 15 variables físicas con significado astrofísico, organizadas en tres familias para definir el espacio físico del problema.
La selección de variables se basó en literatura astrofísica sobre habitabilidad planetaria. No se buscó conservar muchas columnas, sino definir un espacio físico con variables realmente relevantes para comparar planetas con la Tierra de forma interpretable.
Imputación de valores nulos
Los valores faltantes se trataron con una imputación diferenciada en 3 niveles, combinando estadística robusta, supuestos físicos simples y reconstrucción condicional.
a = (P²·M*)1/3
P = √(a³/M*)
Teq ≈ T*√(R*/2a)
S ≈ 10L/a²
En lugar de aplicar una imputación estadística uniforme (como la mediana en todas las variables), se optó por métodos coherentes con la física del problema: supuestos conservadores (e ≈ 0 en órbitas casi circulares) y reconstrucción de variables mediante relaciones físicas como la tercera ley de Kepler.
Outliers y estabilización del espacio
Los valores extremos no se interpretaron automáticamente como errores, sino como casos astronómicamente informativos. Por ello, no se eliminaron de forma agresiva.
Se aplicó winsorización basada en IQR para limitar el impacto de extremos sobre la distancia global sin destruir la estructura física del problema.
Límite inferior = Q1 − 1.5·IQR
Límite superior = Q3 + 1.5·IQR
Marco de comparación
El problema no tenía variable objetivo, por lo que fue necesario definir un criterio cuantitativo: la Tierra como referencia y la habitabilidad como similitud física relativa.
Aquí se concentra el núcleo de problem framing del proyecto: convertir un problema mal definido en un criterio medible, defendible e interpretable.
Construcción del índice
Escalado relativo respecto a la Tierra, cálculo de desviaciones por variable, agregación mediante distancia global y transformación final en un índice continuo interpretable..
La formulación matemática se desarrolla en detalle en el bloque específico de “Construcción del Índice”.
Dataset preparation
The NASA catalogue was reduced to 15 physical variables with astrophysical meaning, organised into three families to define the physical space of the problem.
Domain-driven reduction: before modelling, it was necessary to define which physical dimensions represent relative habitability and allow an interpretable comparison with Earth.
Missing-value imputation
Missing values were handled through a 3-level imputation strategy, combining robust statistics, simple physical assumptions and conditional reconstruction.
a = (P²·M*)1/3
P = √(a³/M*)
Teq ≈ T*√(R*/2a)
S ≈ 10L/a²
Imputation did not simply mean “filling gaps”: in part of the dataset it required reconstructing physical magnitudes from orbital and stellar relationships.
Outliers and space stabilisation
Extreme values were not automatically treated as errors, but as astronomically informative cases. Therefore, they were not aggressively removed.
Lower bound = Q1 − 1.5·IQR
Upper bound = Q3 + 1.5·IQR
IQR-based winsorisation was applied to limit the effect of extremes on global distance without destroying the physical structure of the problem.
Comparison framework
The problem had no target variable, so a quantitative criterion had to be defined: Earth as reference and habitability as relative physical similarity.
This is the core problem-framing contribution of the project: turning an ill-defined problem into a measurable, defensible and interpretable criterion.
Index construction
Habitability was modelled as a physical distance in a variable space, later transformed into an interpretable continuous index.
This step is kept schematic here because its mathematical formulation is developed in detail in the dedicated “Index Construction” section.
Decisiones clave
Key decisions
Interpretabilidad física
No se utilizaron técnicas automáticas como PCA porque reducen variables a componentes difíciles de interpretar físicamente. Cada dimensión del modelo debía corresponder a una propiedad física concreta.
Tierra como referencia
La Tierra se adoptó como referencia del modelo. La habitabilidad no se definió de forma absoluta, sino relativa: un planeta es más habitable cuanto más se parece a la Tierra.
No clustering como solución
Agrupar planetas no resuelve el problema de medir habitabilidad ni permite construir una métrica interpretable. El objetivo no era agrupar, sino comparar cada planeta con una referencia concreta.
Escalado relativo
No se utilizó una estandarización clásica. Las variables se escalaron respecto a la Tierra y al rango real de cada variable, para que las desviaciones mantuvieran interpretación física.
Sin Machine Learning supervisado
No existe una variable objetivo real de habitabilidad ni ejemplos confirmados de planetas habitables más allá de la Tierra. Sin etiquetas reales, un modelo supervisado no aprendería habitabilidad.
Índice continuo y ranking
El modelo no produce una clasificación binaria, sino un índice continuo y un ranking. Esto permite comparar gradualmente la similitud con la Tierra sin imponer fronteras artificiales.
Physical interpretability
Automatic techniques such as PCA were not used because they reduce variables to components that are difficult to interpret physically. Each model dimension had to correspond to a specific physical property.
Earth as the reference
Earth was adopted as the model reference. Habitability was not defined in absolute terms, but relatively: a planet is more habitable the more it resembles Earth.
No clustering as the solution
Grouping planets does not solve the problem of measuring habitability or building an interpretable metric. The goal was not grouping, but comparing each planet with a specific reference.
Relative scaling
Standard normalisation was not used. Variables were scaled with respect to Earth and the real range of each variable so that deviations retained physical meaning.
No supervised Machine Learning
There is no real target variable for habitability and no confirmed examples of habitable planets beyond Earth. Without real labels, a supervised model would not learn habitability.
Continuous index and ranking
The model does not produce a binary classification, but a continuous index and a ranking. This allows gradual comparison of Earth similarity without imposing artificial boundaries.
Construcción del Índice
Index Construction
El índice se construye como una secuencia de transformaciones sobre el espacio físico definido previamente: Tierra como referencia, escalado relativo, desviación por variable, agregación mediante distancia euclídea y transformación final en un índice continuo interpretable.
The index is built as a sequence of transformations over the previously defined physical space: Earth as reference, relative scaling, per-variable deviation, aggregation through Euclidean distance, and final transformation into an interpretable continuous index.
1. Vector Tierra
Cada planeta se compara con un vector de referencia Tierra-Sol definido en las mismas variables del dataset.
\[ \mathbf{x}_{\oplus} = (x_{\oplus,1}, x_{\oplus,2}, \dots, x_{\oplus,p}) \]
El vector Tierra fija el centro físico de la comparación.
2. Escalado relativo
Cada variable se reescala respecto al valor terrestre y a un rango robusto definido por percentiles.
\[ x^{scaled}_{i,j} = \frac{x_{i,j} - x_{\oplus,j}} {P_{99}(x_j) - P_{01}(x_j)} \]
Así la comparación conserva interpretación física y evita que unas magnitudes dominen por escala.
3. Desviación por variable
Se toma el valor absoluto del escalado para medir cuánto se aleja cada planeta de la Tierra en cada dimensión.
\[ d_{i,j} = \left|x^{scaled}_{i,j}\right| \]
En esta fase importa la magnitud de la diferencia, no su signo.
4. Distancia euclidea
Las desviaciones parciales se agregan en una única medida de disimilitud física mediante distancia euclídea.
\[ D_i = \sqrt{\sum_{j=1}^{p} d_{i,j}^{2}} \]
Cuanto mayor es \(D_i\), mayor es la distancia física global respecto a la Tierra.
5. Índice de habitabilidad
La distancia global se transforma en un índice continuo acotado entre 0 y 1.
\[ H_i = \frac{1}{1 + D_i} \]
Valores altos indican mayor similitud con la Tierra; valores bajos, mayor disimilitud física.
1. Earth vector
Each planet is compared against an Earth-Sun reference vector defined in the same variables as the dataset.
\[ \mathbf{x}_{\oplus} = (x_{\oplus,1}, x_{\oplus,2}, \dots, x_{\oplus,p}) \]
The Earth vector fixes the physical centre of the comparison.
2. Relative scaling
Each variable is rescaled with respect to the Earth value and to a robust percentile-based range.
\[ x^{scaled}_{i,j} = \frac{x_{i,j} - x_{\oplus,j}} {P_{99}(x_j) - P_{01}(x_j)} \]
This preserves physical interpretability and avoids domination by raw numerical scale.
3. Per-variable deviation
The absolute value of the scaled deviation is taken to measure how far each planet is from Earth in each dimension.
\[ d_{i,j} = \left|x^{scaled}_{i,j}\right| \]
At this stage, what matters is the magnitude of the difference, not its sign.
4. Global distance
Partial deviations are aggregated into a single measure of physical dissimilarity using Euclidean distance.
\[ D_i = \sqrt{\sum_{j=1}^{p} d_{i,j}^{2}} \]
The larger \(D_i\), the greater the overall physical distance from Earth.
5. Habitability index
The global distance is transformed into a continuous index bounded between 0 and 1.
\[ H_i = \frac{1}{1 + D_i} \]
Higher values indicate greater Earth similarity; lower values indicate greater physical dissimilarity.
Análisis del Índice
Index Analysis
Una vez definido el índice como una transformación de la distancia euclídea al estado Tierra, su análisis permite interpretar el catálogo como un espacio continuo de similitud física. El índice no mide habitabilidad directa, sino cercanía física relativa a las condiciones terrestres dentro del espacio de variables definido en el modelo.
La distribución del índice muestra que la mayoría de los exoplanetas se sitúan lejos del estado Tierra en el espacio físico considerado. Los valores se concentran en rangos bajos e intermedios, mientras que los valores altos son poco frecuentes. Esto indica que los planetas físicamente similares a la Tierra son excepcionales dentro del catálogo y no la norma.
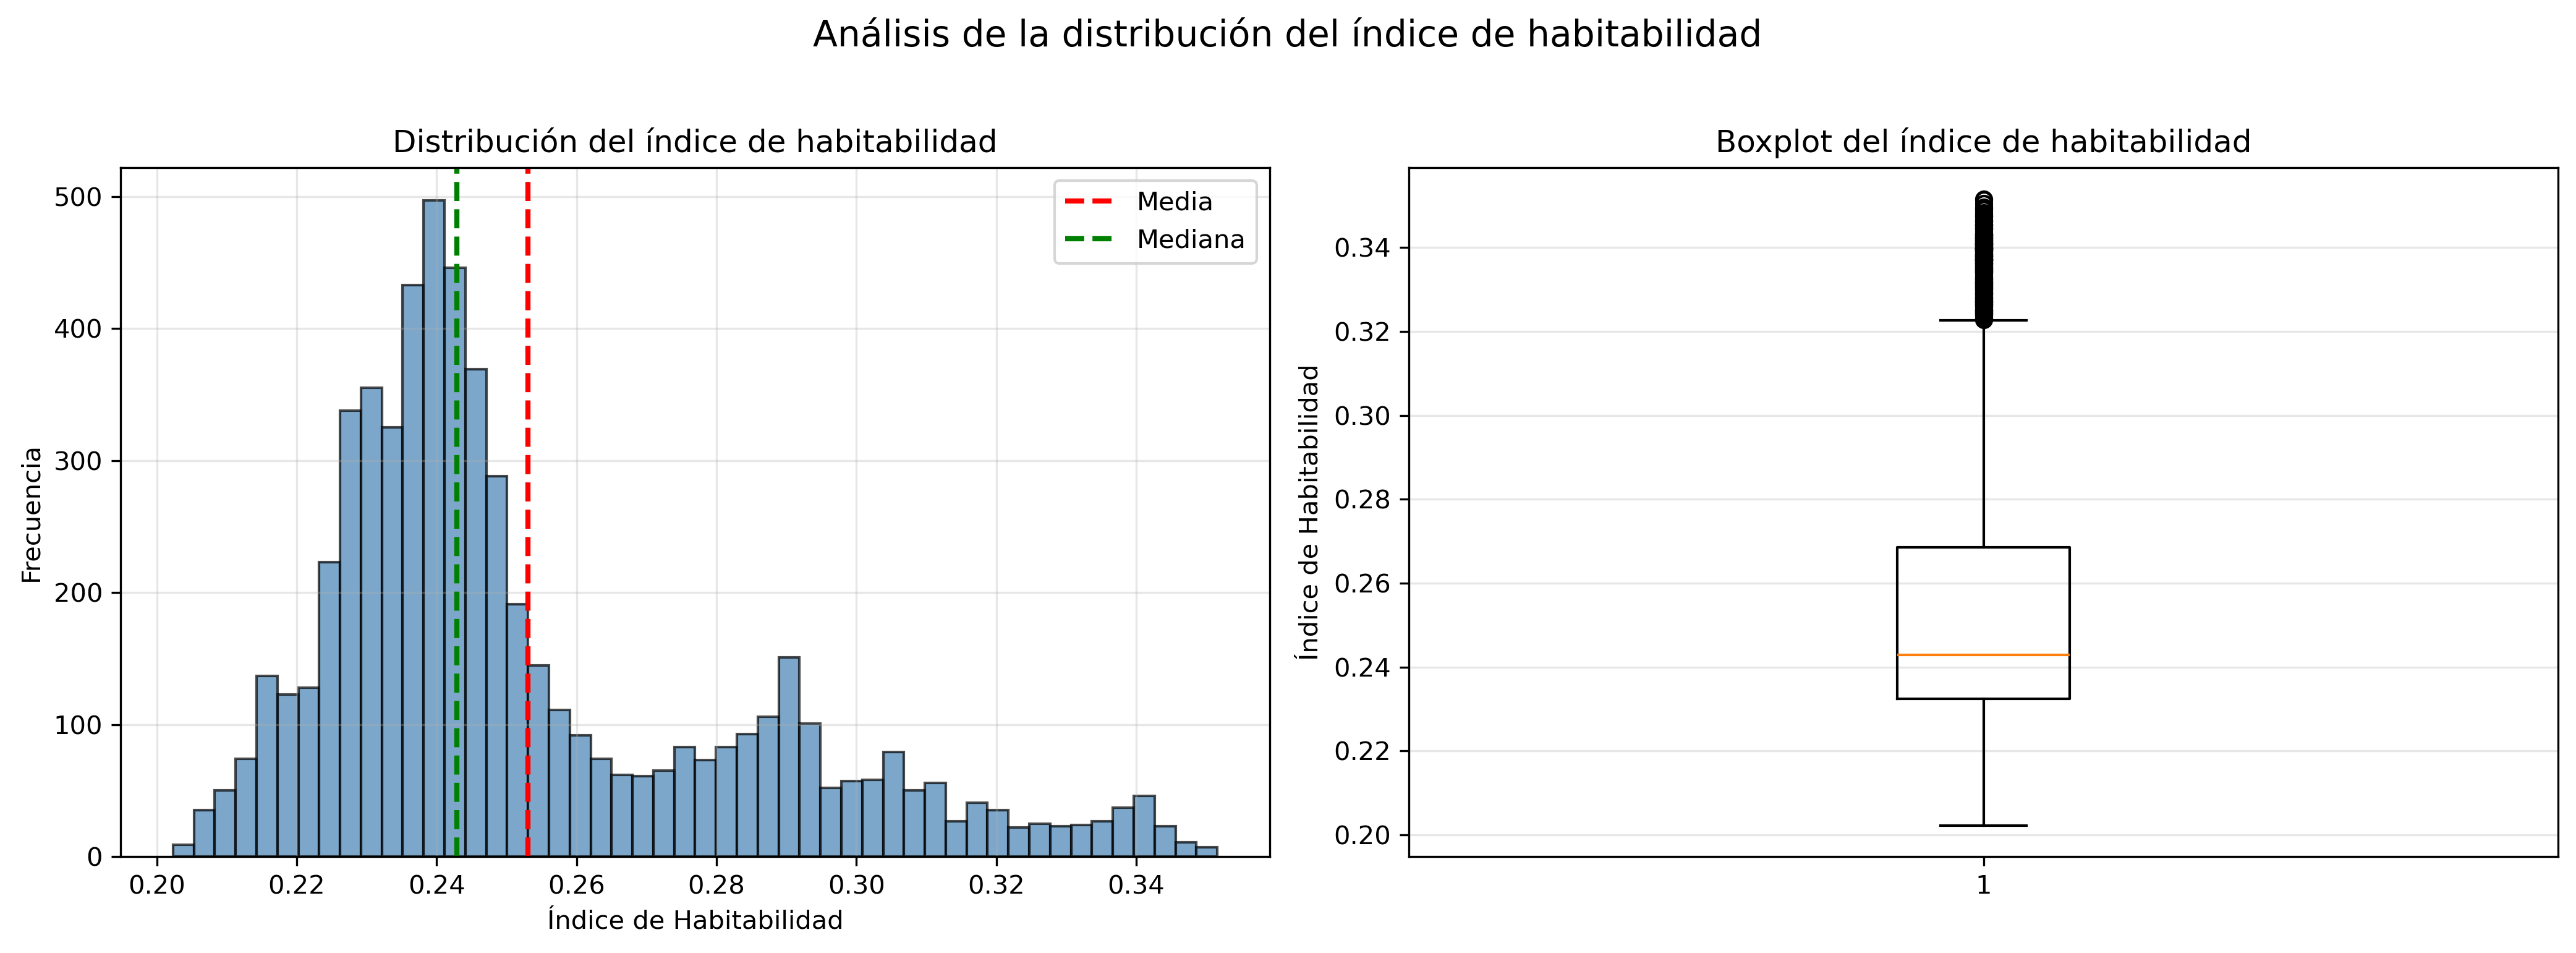
Esta distribución es coherente con la propia formulación del índice. Al estar definido como una función decreciente de la distancia euclídea al vector Tierra, pequeñas diferencias en múltiples variables se acumulan y alejan rápidamente a los planetas del estado de referencia. Por tanto, alcanzar valores altos del índice requiere similitud simultánea en muchas dimensiones físicas, lo que explica la baja densidad de planetas en la zona alta del ranking.
Si se observa el índice a lo largo del ranking, se aprecia un descenso continuo y suave, sin saltos bruscos ni agrupaciones artificiales. Este comportamiento indica que el modelo genera una gradación coherente de similitud física: los planetas no se separan en clases discretas, sino que forman un continuo ordenado por distancia física al estado Tierra.
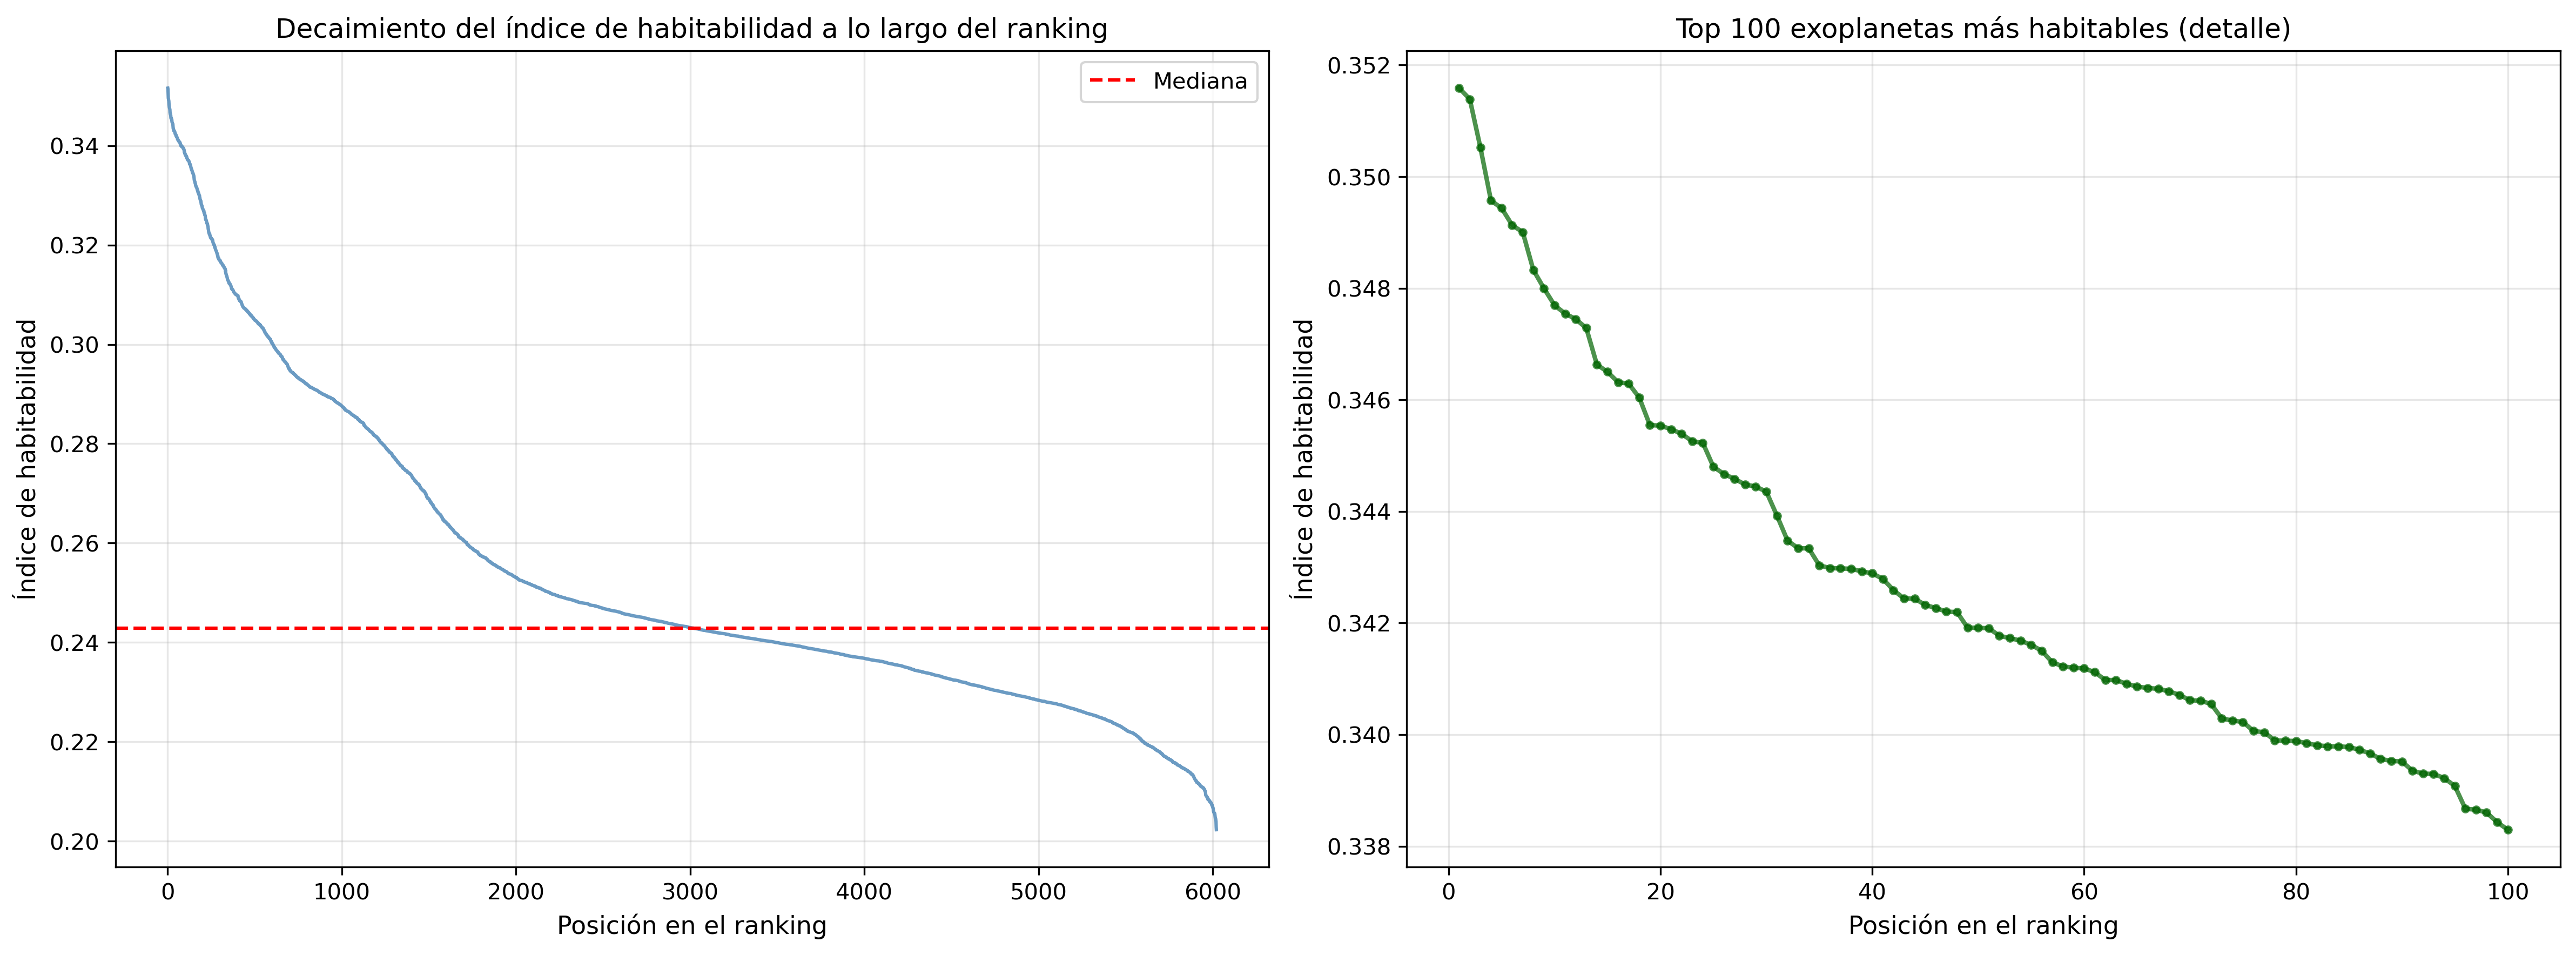
El hecho de que la curva descienda de forma progresiva refuerza la interpretación del índice como una medida de proximidad en un espacio físico y no como una clasificación binaria. En este contexto, el ranking debe interpretarse como una herramienta de priorización: no certifica que un planeta sea habitable, pero sí permite identificar qué objetos son físicamente más parecidos a la Tierra dentro del catálogo disponible.
Además, incluso los primeros puestos del ranking se mantienen lejos del valor teórico máximo del índice (que solo se alcanzaría para un planeta idéntico a la Tierra en todas las variables). Esto sugiere que el catálogo actual no contiene análogos terrestres cercanos, sino planetas que comparten algunas características con la Tierra pero difieren significativamente en otras. El índice, por tanto, no identifica “Tierras”, sino grados de similitud física relativa.
Once the index is defined as a transformation of the Euclidean distance to the Earth state, its analysis allows the catalogue to be interpreted as a continuous space of physical similarity. The index does not measure habitability directly, but relative physical proximity to Earth-like conditions within the variable space defined in the model.
The distribution of the index shows that most exoplanets lie far from the Earth state in the considered physical space. Values are concentrated in low and intermediate ranges, while high index values are rare. This indicates that physically Earth-like planets are exceptional within the catalogue rather than the norm.
This distribution is consistent with the formulation of the index itself. Since it is defined as a decreasing function of the Euclidean distance to the Earth vector, small differences across multiple variables accumulate and quickly move planets away from the reference state. Achieving high index values therefore requires simultaneous similarity across many physical dimensions, which explains the low density of planets in the top part of the ranking.
When observing the index along the ranking, a smooth and continuous decay can be seen, without abrupt jumps or artificial groupings. This behaviour indicates that the model produces a consistent gradient of physical similarity: planets are not separated into discrete classes, but form a continuum ordered by physical distance to the Earth state.
The progressive decay of the curve reinforces the interpretation of the index as a proximity measure in a physical space rather than a binary classification. In this context, the ranking should be interpreted as a prioritisation tool: it does not certify habitability, but it allows identifying which objects are physically more similar to Earth within the available catalogue.
Moreover, even the top-ranked planets remain far from the theoretical maximum of the index (which would only be reached by a planet identical to Earth in all variables). This suggests that the current catalogue does not contain close Earth analogues, but rather planets that share some Earth-like characteristics while differing significantly in others. The index therefore identifies degrees of relative physical similarity, not “second Earths”.
En este sentido, el índice debe interpretarse como una medida de similitud física relativa dentro de un modelo definido, no como una medida absoluta de habitabilidad. Su utilidad principal es estructurar el catálogo y permitir comparar exoplanetas dentro de un marco físico común.
Resultados
Results
Si el bloque anterior mostraba que el catálogo completo se distribuye lejos del estado Tierra, el siguiente paso es observar qué ocurre en la parte alta del ranking. El resultado más visible del proyecto es un Top 10 interpretable de exoplanetas ordenados según su similitud física relativa con la Tierra dentro del espacio definido por el modelo.
En las primeras posiciones aparecen planetas como KMT-2021-BLG-0912L b, Kepler-1638 b, Kepler-1040 b, Kepler-1606 b o Kepler-452 b. Estos nombres no deben interpretarse como “planetas habitables confirmados”, sino como los objetos que, dentro del catálogo disponible, ocupan las posiciones más próximas al vector Tierra según la métrica construida.
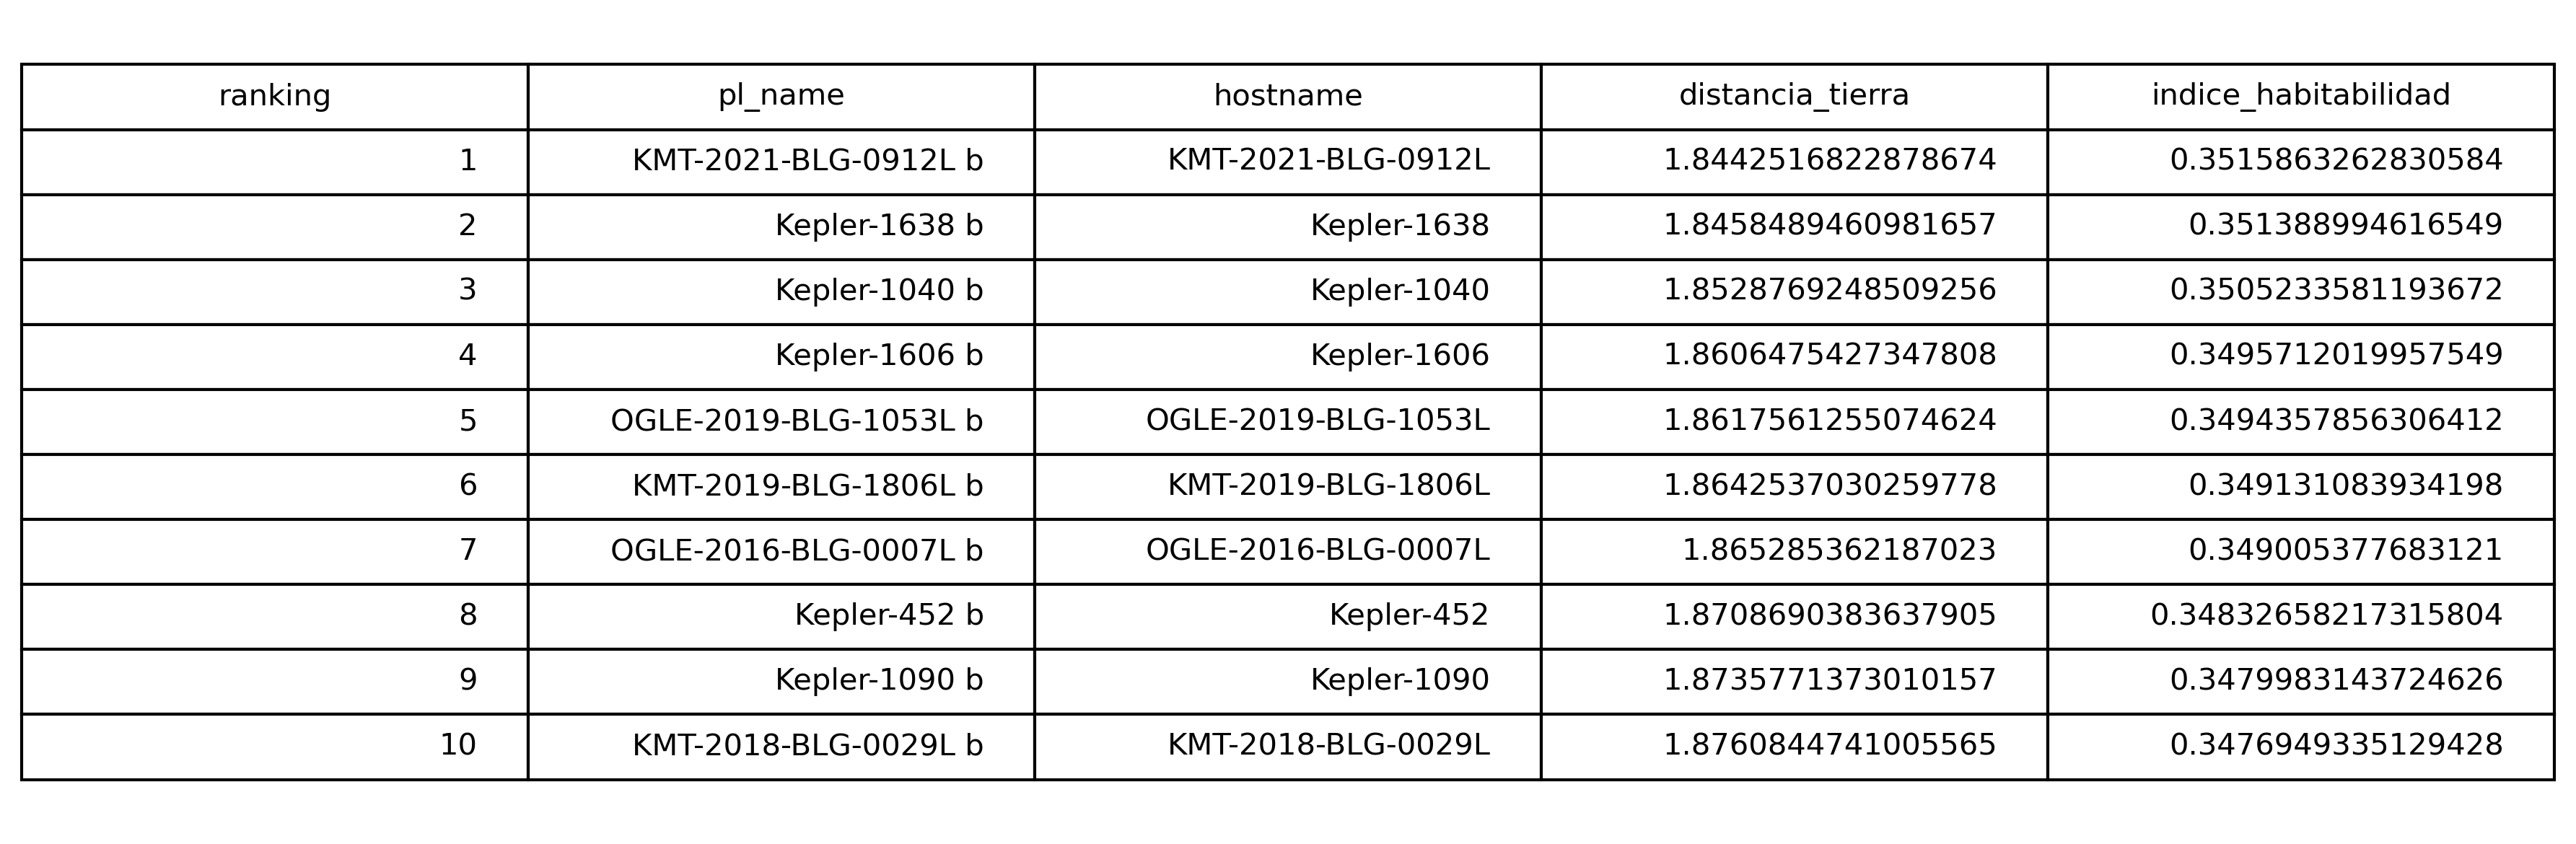
Sin embargo, el resultado más importante no es solo quién ocupa esos primeros puestos, sino la escala en la que aparecen. El mejor valor del índice es aproximadamente 0.35, mientras que el décimo planeta se sitúa en torno a 0.347. Dado que el máximo teórico del índice sería 1 para un planeta idéntico a la Tierra en todas las dimensiones del modelo, esto significa que incluso los mejores candidatos detectados siguen estando lejos de un verdadero análogo terrestre.
Este punto es clave porque conecta directamente con el análisis del bloque anterior: la rareza de valores altos en la distribución no era solo una propiedad abstracta del índice, sino que se refleja también en la parte más favorable del ranking. El modelo no encuentra “Tierras 2.0”; encuentra los planetas menos alejados dentro de un catálogo que, en conjunto, permanece distante de la referencia terrestre.
En este sentido, el resultado es coherente con una formulación exigente del problema. El índice no está diseñado para inflar similitudes ni para forzar una lectura optimista, sino para conservar la dificultad real de encontrar configuraciones físicas cercanas a la Tierra. Precisamente por eso, que los mejores planetas aparezcan con valores moderados refuerza la credibilidad interpretativa del modelo.
Además, el análisis de sensibilidad del proyecto muestra que esta estructura del ranking es robusta frente a cambios en el escalado. Al modificar el esquema de percentiles utilizado para normalizar las variables, el Top 10 se mantiene y la correlación entre rankings sigue siendo prácticamente perfecta. Esto indica que el resultado no depende de una calibración frágil, sino de una estructura estable en los datos físicos del catálogo.
Por tanto, el resultado final del proyecto no es únicamente una lista ordenada de planetas. Es una forma cuantitativa, interpretable y reproducible de priorizar candidatos en un problema que originalmente no tenía variable objetivo. Ese paso, es decir, convertir un concepto difuso en un criterio operativo de comparación, es la principal aportación metodológica del proyecto.
If the previous section showed that the full catalogue is distributed far from the Earth state, the next step is to examine what happens at the top of the ranking. The most visible output of the project is an interpretable Top 10 of exoplanets ordered by their relative physical similarity to Earth within the model-defined space.
The highest positions include planets such as KMT-2021-BLG-0912L b, Kepler-1638 b, Kepler-1040 b, Kepler-1606 b, and Kepler-452 b. These names should not be interpreted as “confirmed habitable planets”, but as the objects that occupy the closest positions to the Earth vector according to the metric built in the project.
However, the most important result is not only who appears at the top, but the scale at which they appear. The highest index value is approximately 0.35, while the tenth-ranked planet is around 0.347. Since the theoretical maximum of the index would be 1 for a planet identical to Earth in all model dimensions, this means that even the best detected candidates remain far from a true Earth analogue.
This point is crucial because it connects directly with the previous analysis: the rarity of high values in the distribution was not just an abstract property of the index, but something that is also reflected in the most favourable part of the ranking. The model does not find “Earth 2.0” planets; it finds the least distant planets within a catalogue that, overall, remains far from the terrestrial reference.
In that sense, the result is consistent with a demanding formulation of the problem. The index is not designed to inflate similarities or force an optimistic interpretation, but to preserve the real difficulty of finding physical configurations close to Earth. Precisely for that reason, the fact that even the best planets only reach moderate values reinforces the interpretability and credibility of the model.
In addition, the project’s sensitivity analysis shows that this ranking structure is robust to changes in scaling. When the percentile scheme used to normalise the variables is modified, the Top 10 remains stable and the correlation between rankings stays almost perfect. This indicates that the result does not depend on fragile calibration, but on a stable structure in the physical data of the catalogue.
Therefore, the final result of the project is not only a ranked list of planets. It is a quantitative, interpretable, and reproducible way of prioritising candidates in a problem that originally had no target variable. Turning a diffuse concept into an operational comparison criterion is the main methodological contribution of the project.
Aplicación interactiva
Interactive application
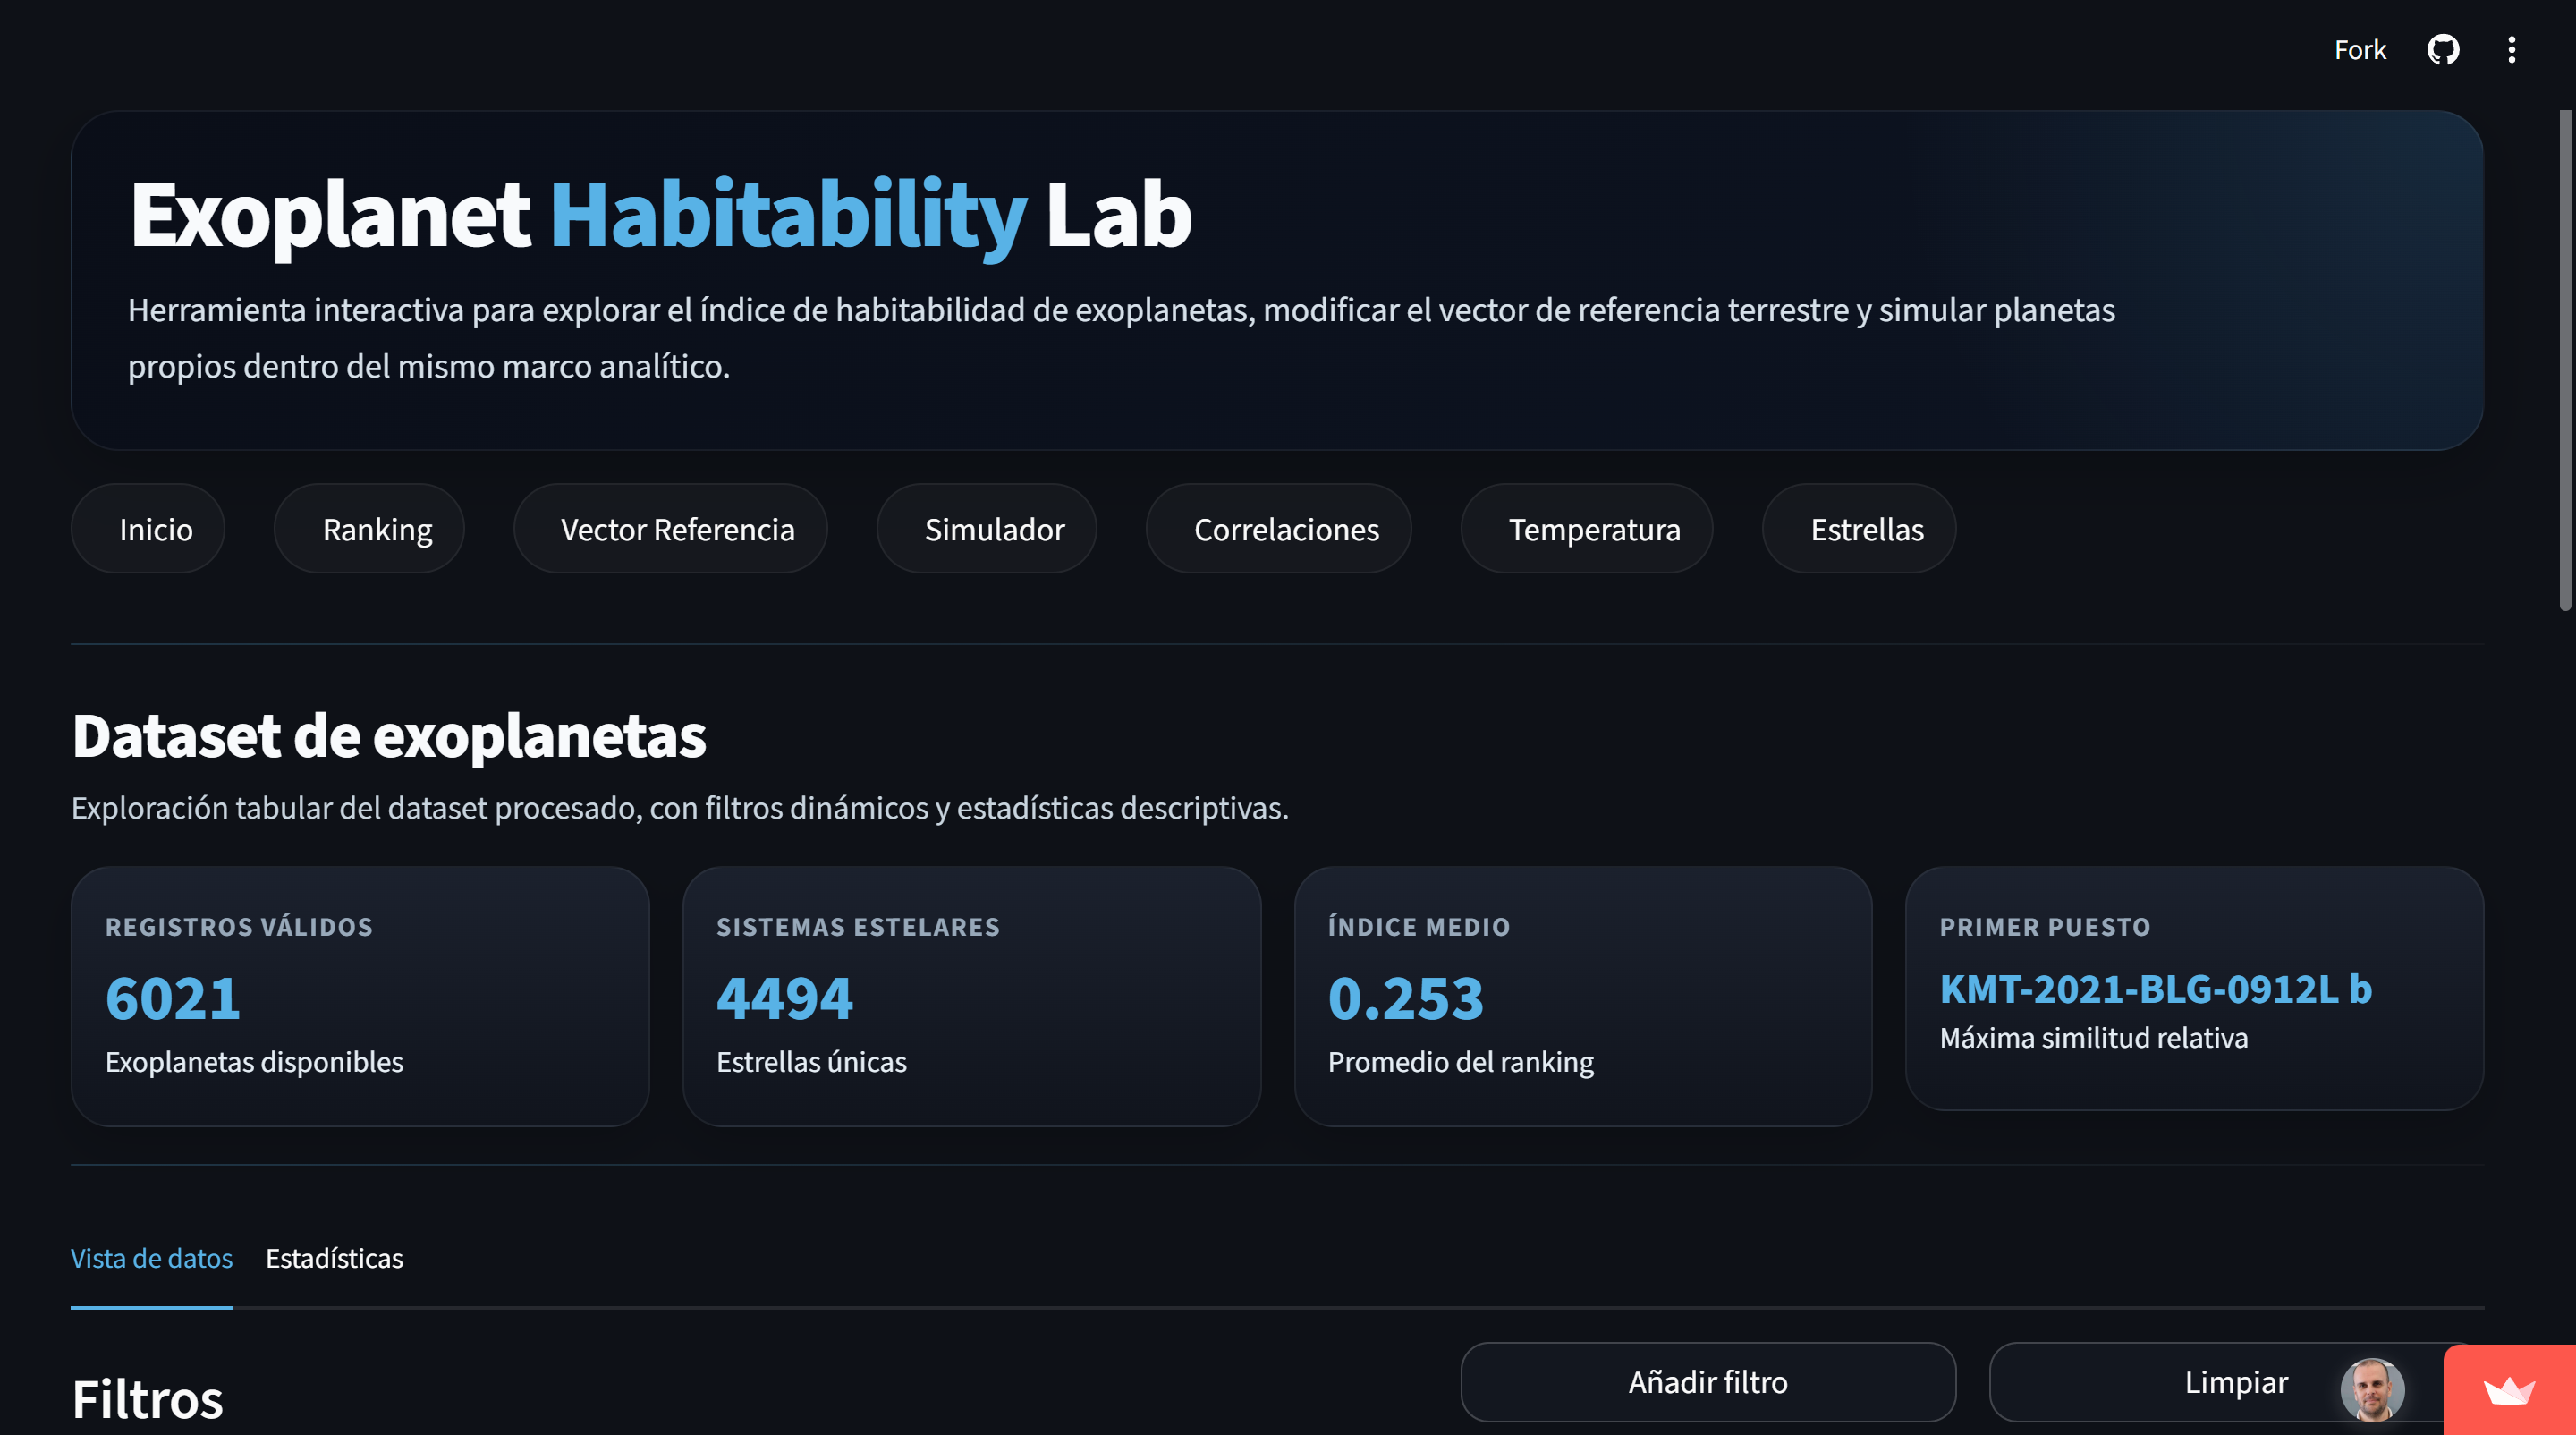
Como resultado final, desarrollé una aplicación interactiva para explorar el ranking de exoplanetas, visualizar sus características y entender su posición relativa en el índice de habitabilidad.
As a final outcome, I developed an interactive application to explore the exoplanet ranking, visualise their characteristics and understand their relative position in the habitability index.
Si la app está dormida, pulsa el botón de Yes, get this app back up! y espera unos segundos para que se inicie despierte 😄
The app may take a few seconds to load on first visit 😄
Arquitectura y Tecnologías utilizadas
Architecture and technologies
Este proyecto recorre el flujo completo desde la definición del problema hasta la construcción de una solución interactiva. Python se utiliza para preparar los datos, construir el índice de habitabilidad y generar el dataset final, mientras que la aplicación web permite explorar el ranking y simular cómo cambia el índice al modificar las variables de un planeta ficticio.
This project covers the full workflow from problem definition to the construction of an interactive solution. Python is used to prepare the data, build the habitability index, and generate the final dataset, while the web application makes it possible to explore the ranking and simulate how the index changes when modifying the variables of a fictional planet.
Python
Análisis, limpieza, imputación, tratamiento de outliers y cálculo del índice.
Pandas + NumPy
Transformación del catálogo, operaciones numéricas y construcción del pipeline analítico.
Matplotlib + Seaborn
Visualización del comportamiento del índice, distribución del ranking y análisis de resultados.
Streamlit + HTML + CSS
Aplicación interactiva para explorar el ranking y probar cómo cambian los resultados al modificar variables.
Python
Analysis, cleaning, imputation, outlier handling, and index calculation.
Pandas + NumPy
Catalogue transformation, numerical operations, and construction of the analytical pipeline.
Matplotlib + Seaborn
Visualisation of index behaviour, ranking distribution, and results analysis.
HTML + CSS + JavaScript
Interactive application to explore the ranking and test how results change when modifying variables.
 Python
 Pandas
 NumPy
NumPy
 Matplotlib
 Seaborn
 HTML
HTML
 CSS
CSS
 Streamlit
Qué demuestra este proyecto
What this project demonstrates
Este proyecto aborda un problema en el que la variable objetivo no está definida de forma directa. En este tipo de situaciones, el primer paso no es entrenar un modelo, sino definir correctamente qué queremos medir y cómo traducir un concepto difuso en una variable cuantificable.
A lo largo del proyecto se desarrolla el proceso completo: definición del problema, selección de variables, construcción del índice, análisis de resultados e interpretación. El resultado no se queda en el análisis, sino que se transforma en una aplicación interactiva que permite explorar el catálogo y aplicar el modelo de forma práctica. Además, la aplicación permite definir un planeta ficticio modificando sus variables y observar cómo cambia el índice, lo que permite entender el impacto de cada variable en el resultado final.
Más que un ejercicio de modelado, el proyecto muestra un enfoque de trabajo en Data Science centrado en estructurar problemas complejos, construir variables interpretables y convertir el análisis en herramientas que puedan utilizarse en contextos reales de toma de decisiones.
This project addresses a problem where the target variable is not directly defined. In these situations, the first step is not training a model, but properly defining what we want to measure and how to translate a diffuse concept into a quantifiable variable.
Throughout the project, the entire process is carried out: problem definition, variable selection, index construction, analysis of results, and interpretation. The result goes beyond mere analysis; it is transformed into an interactive application that allows users to explore the catalog and apply the model in a practical way. Furthermore, the application allows users to define a fictional planet by modifying its variables and observe how the index changes, thereby helping them understand the impact of each variable on the final result.
More than a modelling exercise, this project presents a Data Science workflow focused on structuring complex problems, building interpretable variables, and turning analysis into tools that can be used in real decision-making contexts.